Risk Navigator
The Risk NavigatorSM is a real-time market-risk management platform that provides a comprehensive measure of risk exposure across multiple asset classes around the globe.
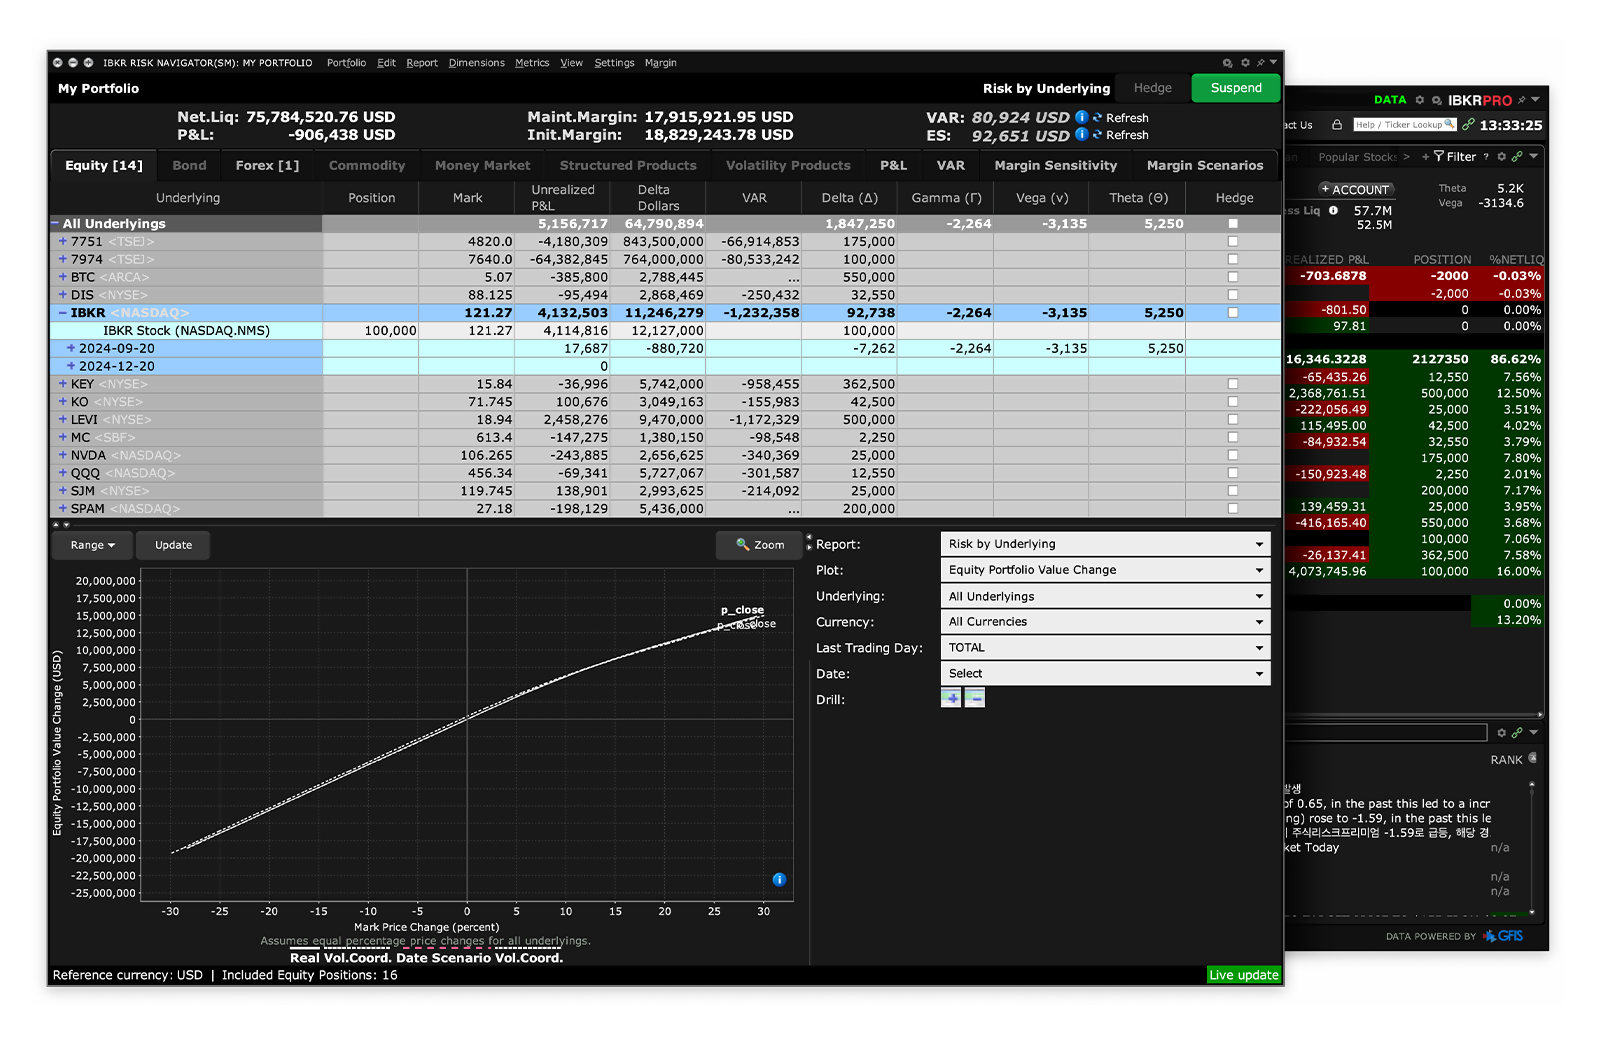
Its easy-to-read spreadsheet-like interface lets you quickly identify exposure to risk starting at the portfolio level, with drill-down access into successively deeper levels of detail within multiple report views.
The Risk Navigator offers traders the following benefits:
- View your entire risk in a single number while monitoring the total risk and direction of risk associated with a single position.
- View your portfolio risk for multiple asset classes and assess specific risk slices of your portfolio, such as risk by position, risk by underlying, and risk by industry.
- Create an editable, hypothetical "What-If" portfolio based on your actual portfolio to see how your risk profile might change based on changes, such as adding, closing, reducing or increasing positions.
- Create complex custom scenarios by editing the price, date and volatility variables that affect your risk profile.
- Equity Portfolio Managers can use the Risk Navigator's advanced beta analysis to build their portfolios based on key concepts of the Capital Asset Pricing Model.
- Build, maintain and monitor positions in a separate area by building new portfolios.
- See how capital is being allocated on a day-to-day or even minute-to-minute basis.
- Use the Portfolio Relative P&L graph to see how the total value of your portfolio for a specific asset class (or a subset of your portfolio) will change based on a percent change in the price(s) of the underlying(s).
USER GUIDES
Get Started with Risk Navigator
For more information on Risk Navigator, select your trading platform.
Any symbols displayed are for illustrative purposes only and do not portray a recommendation.
The projections or other information generated by the Risk Navigator tool regarding the likelihood of various investment outcomes are hypothetical in nature, do not reflect actual investment results and are not guarantees of future results. Please note that results may vary with use of the tool over time.